Predict TCR and HLA association
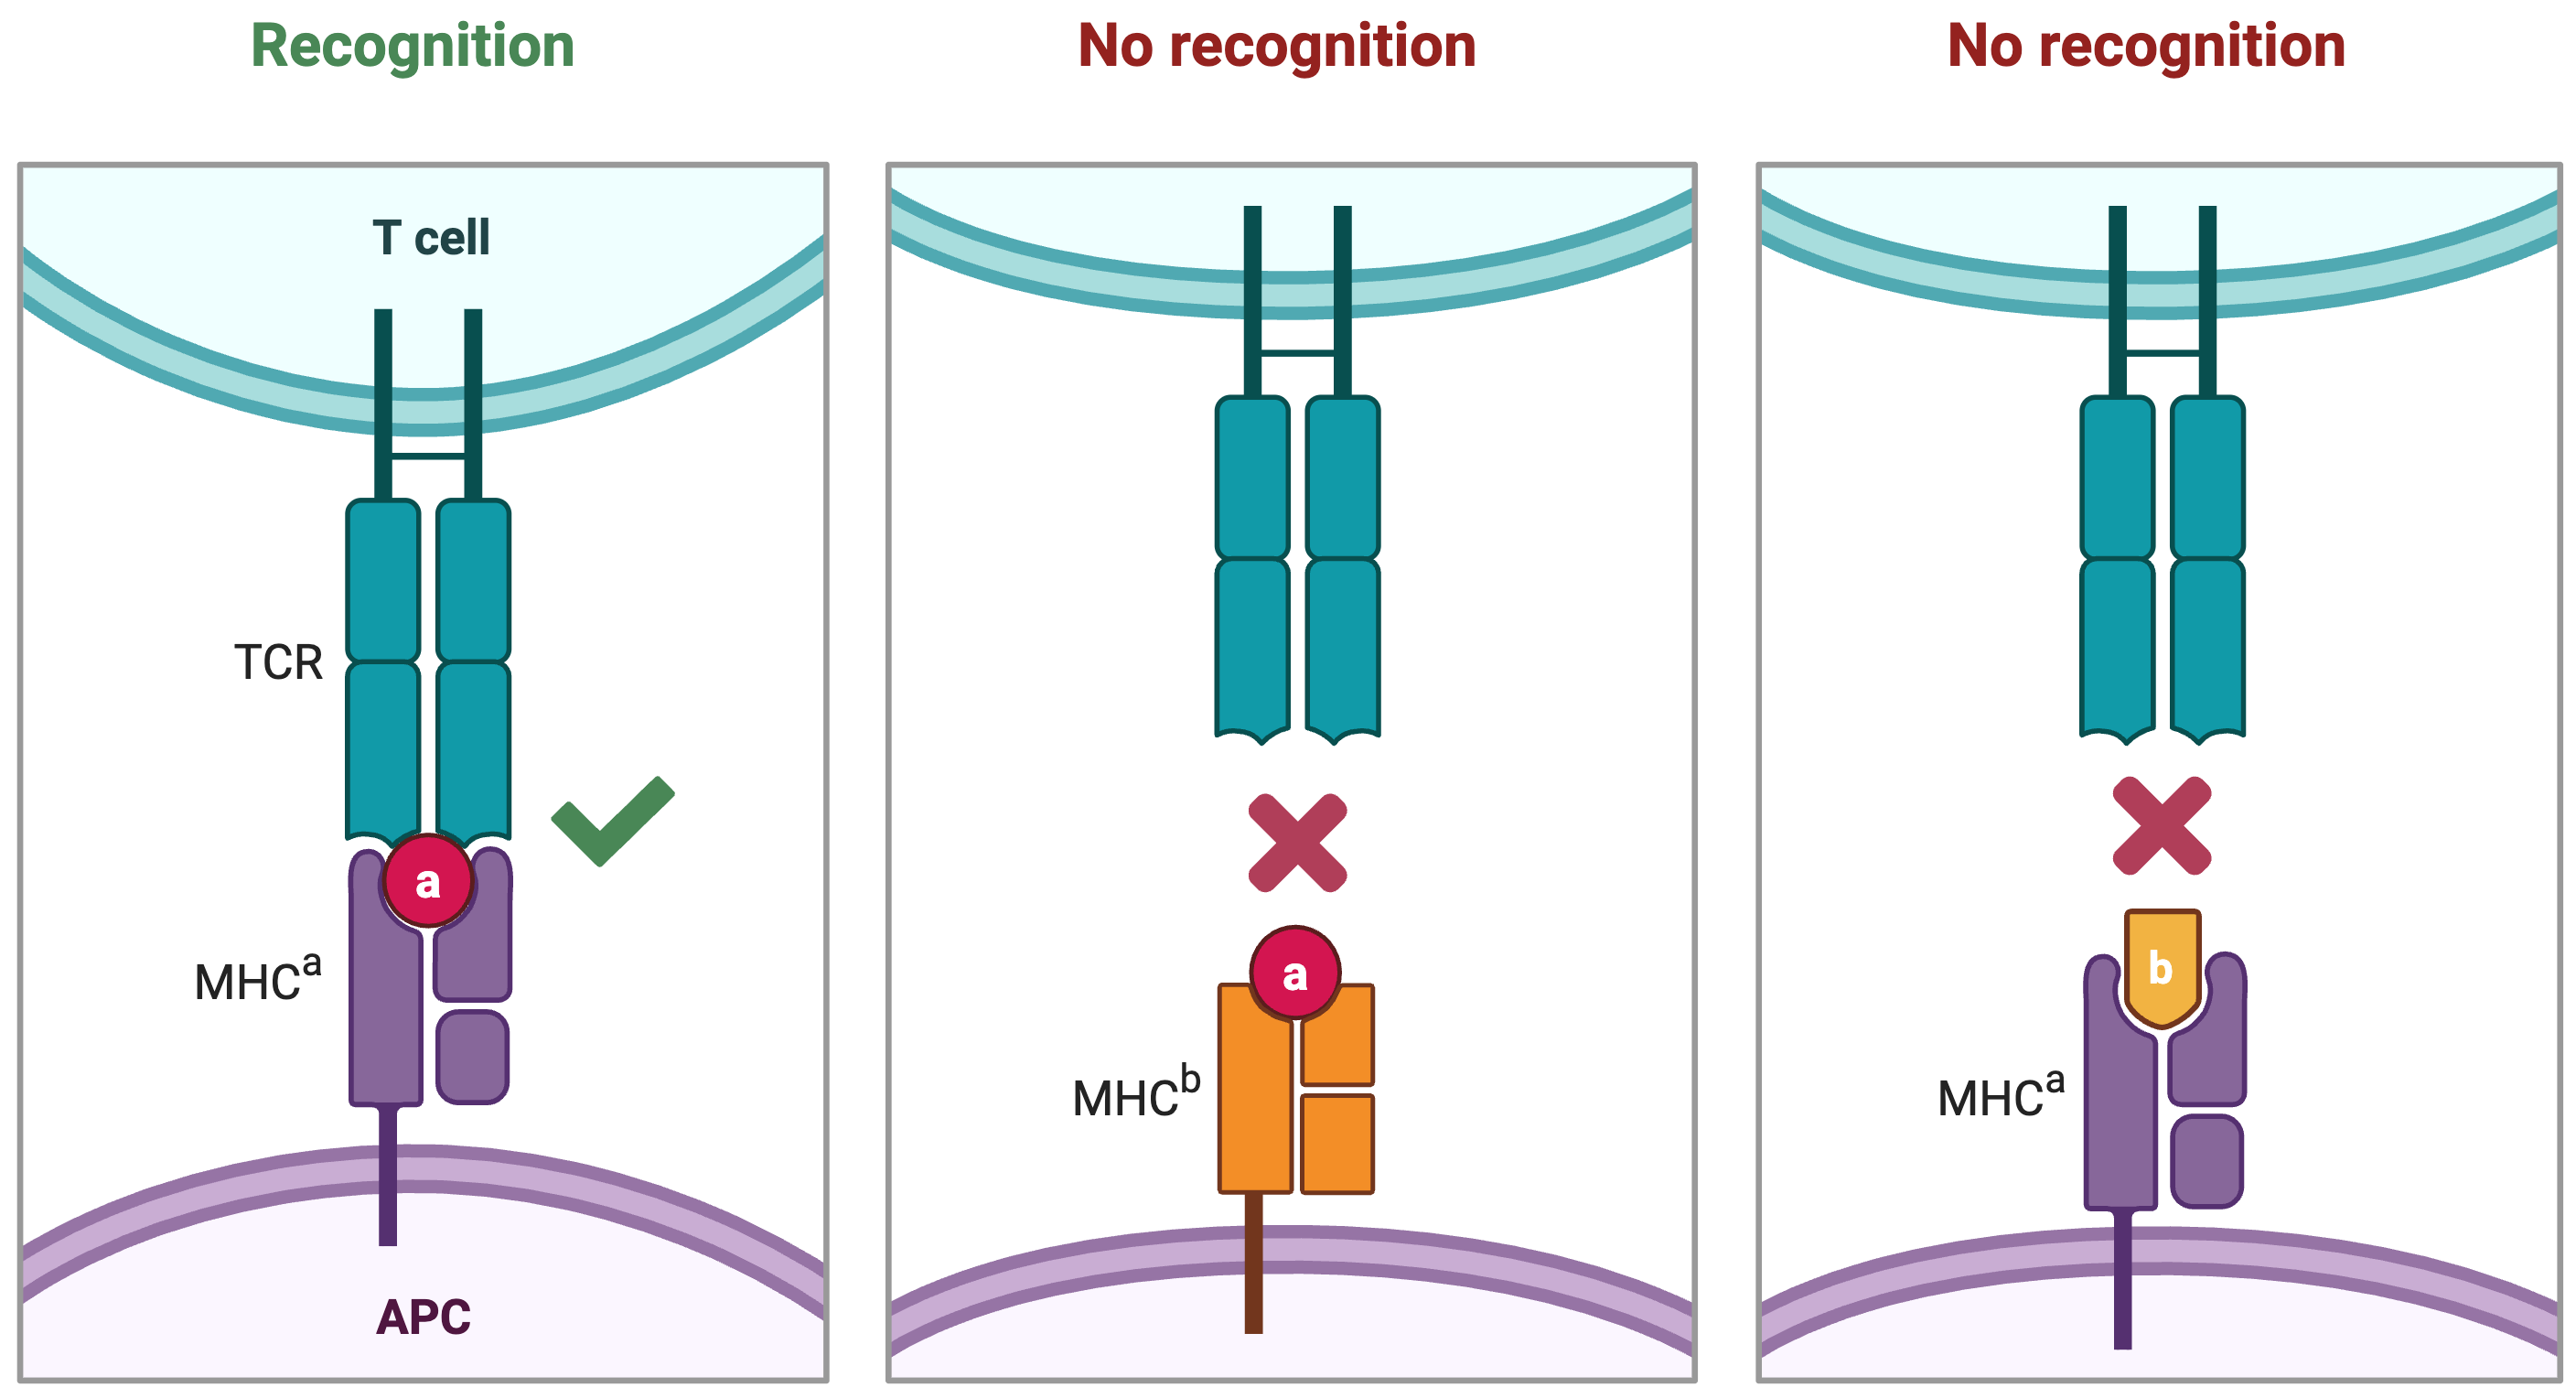
T cells serve as a record of an individual’s immune responses, with certain TCRs exclusively found in individuals carrying specific HLA alleles. Therefore, a comprehensive analysis of TCR–HLA associations is crucial for characterizing TCRs and understanding their antigen specificities. By uncovering patterns of TCR–HLA co-occurrence, we can gain insight into the rules governing T cell recognition, improve prediction of antigen-specific responses, and identify potential biomarkers for infection, autoimmunity, or cancer. Moreover, such insights are essential for the development of precision immunotherapies and vaccine strategies tailored to individual HLA backgrounds.
Load required libraries
import pandas as pd
from trimap import utils
import trimap
from trimap.model import TCRbind
import torch
import numpy as np

print(f"Using trimap version {trimap.__version__}")

seed = 1234
np.random.seed(seed)
torch.manual_seed(seed)
torch.cuda.manual_seed(seed)
torch.cuda.manual_seed_all(seed)
torch.backends.cudnn.benchmark = False
torch.backends.cudnn.deterministic = True
device = torch.device("cuda:0" if torch.cuda.is_available() else "cpu")
Using trimap version 1.0.5
Load our training data
TCRs with alpha and beta chain, V and J gene information
HLA information
df_data = pd.read_csv('VDJdb.csv')

df_data['alpha'] = utils.determine_tcr_seq_vj(df_data['alpha'].tolist(), df_data['V_alpha'].tolist(), df_data['J_alpha'].tolist(), chain='A')
df_data['beta'] = utils.determine_tcr_seq_vj(df_data['beta'].tolist(), df_data['V_beta'].tolist(), df_data['J_beta'].tolist(), chain='B')
hla_dict = np.load('hla_dict_34.npy', allow_pickle=True).item()
hla_name = ['HLA-'+i for i in list(hla_dict.keys())]
df_data = df_data[df_data['HLA'].isin(hla_name)]
Randomly split the data into training and test sets
df_train = df_data.sample(frac=0.8, random_state=seed)
df_test = df_data.drop(df_train.index)
df_train.reset_index(drop=True, inplace=True)
df_test.reset_index(drop=True, inplace=True)
Train and save the model
model = TCRbind().to(device)
model.train_model(df=df_train, num_epochs=20, device=device, targets='hla', hla_dict=hla_dict, hla_model_dir='hla_model.pt')
torch.save(model.state_dict(), 'TCR_HLA_model.pt')
INFO:trimap.model:Training...
/local_home/cao/miniconda3/envs/trimap-env/lib/python3.9/site-packages/tqdm/auto.py:21: TqdmWarning: IProgress not found. Please update jupyter and ipywidgets. See https://ipywidgets.readthedocs.io/en/stable/user_install.html
  from .autonotebook import tqdm as notebook_tqdm
You are using the default legacy behaviour of the <class 'transformers.models.t5.tokenization_t5.T5Tokenizer'>. This is expected, and simply means that the `legacy` (previous) behavior will be used so nothing changes for you. If you want to use the new behaviour, set `legacy=False`. This should only be set if you understand what it means, and thoroughly read the reason why this was added as explained in https://github.com/huggingface/transformers/pull/24565
INFO:trimap.model:Loading alpha_dict.pt
INFO:trimap.model:Found new alpha sequences, embedding...
100%|██████████| 8/8 [00:36<00:00,  4.52s/it]
INFO:trimap.model:Updated and saved alpha_dict.pt
INFO:trimap.model:Loading beta_dict.pt
INFO:trimap.model:Found new beta sequences, embedding...
100%|██████████| 8/8 [00:35<00:00,  4.44s/it]
INFO:trimap.model:Updated and saved beta_dict.pt
100%|██████████| 292/292 [01:31<00:00,  3.18it/s]
Epoch [1/20], Loss: 0.6165, ROC: 0.5775
100%|██████████| 292/292 [01:49<00:00, 2.67it/s]
Epoch [2/20], Loss: 0.5566, ROC: 0.6337
100%|██████████| 292/292 [01:40<00:00, 2.91it/s]
Epoch [3/20], Loss: 0.5209, ROC: 0.6567
100%|██████████| 293/293 [01:43<00:00, 2.83it/s]
Epoch [4/20], Loss: 0.5115, ROC: 0.6716
100%|██████████| 293/293 [01:40<00:00, 2.90it/s]
Epoch [5/20], Loss: 0.4143, ROC: 0.6811
100%|██████████| 292/292 [01:44<00:00, 2.79it/s]
Epoch [6/20], Loss: 0.5886, ROC: 0.6893
100%|██████████| 292/292 [01:37<00:00, 2.99it/s]
Epoch [7/20], Loss: 0.4995, ROC: 0.6974
100%|██████████| 293/293 [01:43<00:00, 2.83it/s]
Epoch [8/20], Loss: 0.5272, ROC: 0.7074
100%|██████████| 292/292 [01:50<00:00, 2.63it/s]
Epoch [9/20], Loss: 0.4863, ROC: 0.7110
100%|██████████| 293/293 [01:56<00:00, 2.51it/s]
Epoch [10/20], Loss: 0.5902, ROC: 0.7174
100%|██████████| 293/293 [01:52<00:00, 2.60it/s]
Epoch [11/20], Loss: 0.5330, ROC: 0.7232
100%|██████████| 292/292 [01:44<00:00, 2.80it/s]
Epoch [12/20], Loss: 0.5226, ROC: 0.7295
100%|██████████| 292/292 [01:58<00:00, 2.46it/s]
Epoch [13/20], Loss: 0.5296, ROC: 0.7363
100%|██████████| 292/292 [01:55<00:00, 2.53it/s]
Epoch [14/20], Loss: 0.5217, ROC: 0.7415
100%|██████████| 292/292 [01:50<00:00, 2.63it/s]
Epoch [15/20], Loss: 0.4597, ROC: 0.7465
100%|██████████| 292/292 [01:52<00:00, 2.60it/s]
Epoch [16/20], Loss: 0.5400, ROC: 0.7505
100%|██████████| 292/292 [01:51<00:00, 2.61it/s]
Epoch [17/20], Loss: 0.3734, ROC: 0.7555
100%|██████████| 292/292 [01:44<00:00, 2.79it/s]
Epoch [18/20], Loss: 0.5391, ROC: 0.7628
100%|██████████| 292/292 [01:52<00:00, 2.59it/s]
Epoch [19/20], Loss: 0.4631, ROC: 0.7670
100%|██████████| 292/292 [01:48<00:00, 2.70it/s]
Epoch [20/20], Loss: 0.4870, ROC: 0.7733
(optional) Load pretrained model
model = TCRbind().to(device)
model.load_state_dict(torch.load('TCR_HLA_model.pt', map_location=device))
<All keys matched successfully>
Test the performance of the model
Adding negative samples to the test set
df_test_negtaive = utils.negative_sampling(df_test)
df_test['label'] = 1
df_test_negtaive['label'] = 0
df_test = pd.concat([df_test, df_test_negtaive])
df_test.reset_index(drop=True, inplace=True)

result, cdr3a_attn, cdr3b_attn = model.test_model(df_test=df_test, device=device, targets='hla', hla_dict=hla_dict, hla_model_dir='HLA_model.pt')
df_test['pred'] = result
INFO:trimap.model:Loading alpha_dict.pt
INFO:trimap.model:No new alpha sequences found
INFO:trimap.model:Loading beta_dict.pt
INFO:trimap.model:No new beta sequences found
INFO:trimap.model:Predicting...
100%|██████████| 74/74 [00:27<00:00,  2.73it/s]
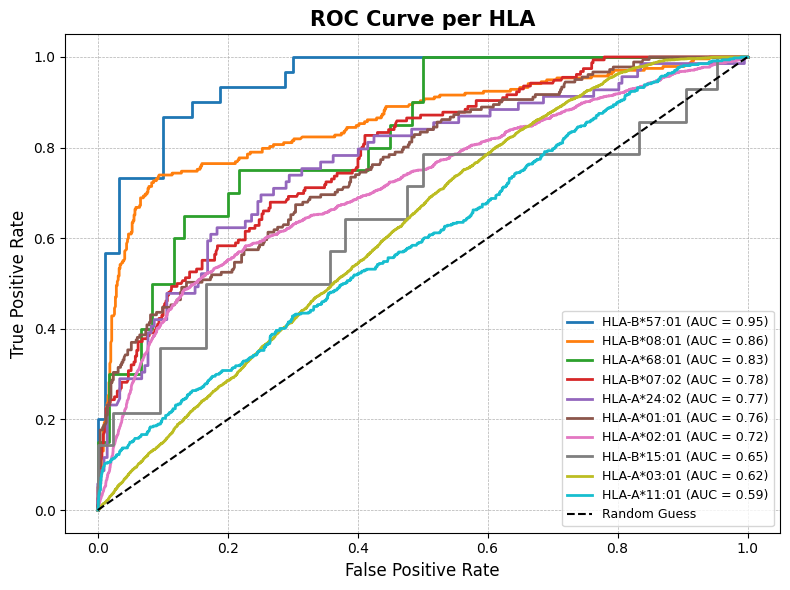
Show the performance of top 10 HLA alleles
import matplotlib.pyplot as plt
from sklearn.metrics import roc_curve, auc

def plot_roc_per_hla(df, pred_col='pred', label_col='label', hla_col='HLA', top_k=10, figsize=(8, 6), title='ROC Curve per HLA'):
    """
    Plot ROC curves for the top-k most frequent HLAs based on AUC.

    Args:
        df (pd.DataFrame): DataFrame with HLA, prediction, and label columns.
        pred_col (str): Column name for predicted scores.
        label_col (str): Column name for ground truth labels (0/1).
        hla_col (str): Column name for HLA type.
        top_k (int): Number of most frequent HLAs to plot.
        figsize (tuple): Figure size.
        title (str): Title of the plot.
    """
    # Get top-k most frequent HLAs
    top_hlas = df[hla_col].value_counts().head(top_k).index.tolist()

    hla_auc = {}

    # Compute AUCs
    for hla in top_hlas:
        hla_df = df[df[hla_col] == hla]
        fpr, tpr, _ = roc_curve(hla_df[label_col].values, hla_df[pred_col].values)
        hla_auc[hla] = auc(fpr, tpr)

    # Sort HLAs by AUC
    sorted_hlas = sorted(top_hlas, key=lambda x: hla_auc[x], reverse=True)

    # Plot
    fig, ax = plt.subplots(figsize=figsize)
    for hla in sorted_hlas:
        hla_df = df[df[hla_col] == hla]
        fpr, tpr, _ = roc_curve(hla_df[label_col].values, hla_df[pred_col].values)
        ax.plot(fpr, tpr, lw=2, label=f'{hla} (AUC = {hla_auc[hla]:.2f})')

    # Baseline and formatting
    ax.plot([0, 1], [0, 1], 'k--', label='Random Guess')
    ax.set_xlabel('False Positive Rate', fontsize=12)
    ax.set_ylabel('True Positive Rate', fontsize=12)
    ax.set_title(title, fontsize=15, fontweight='bold')
    ax.legend(loc='lower right', fontsize=9)
    ax.grid(True, linestyle='--', linewidth=0.5)
    plt.tight_layout()
    plt.show()

plot_roc_per_hla(df_test, pred_col='pred', label_col='label', hla_col='HLA', top_k=10)
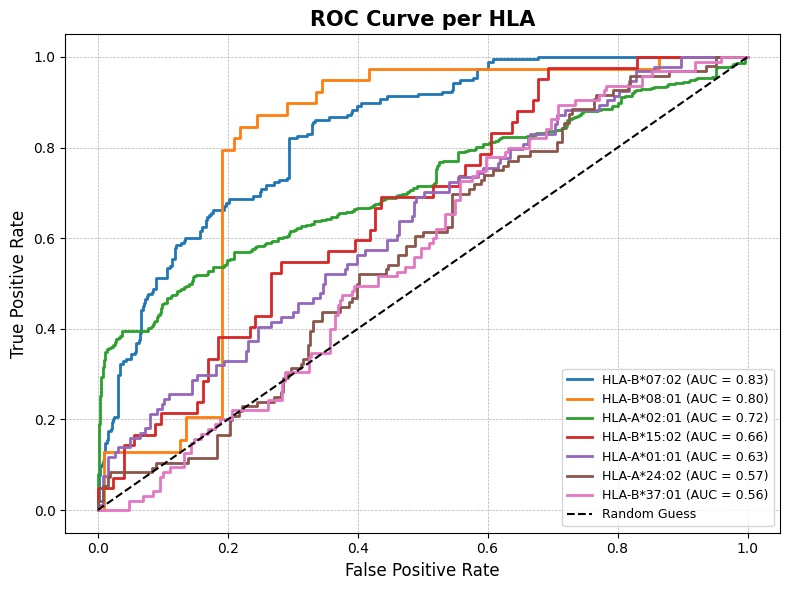
Generalize to other unseen TCRs from external IEDB dataset
Download IEDB_HLA_top7.csv.
IEDB = pd.read_csv('IEDB_HLA_top7.csv')
print(IEDB['HLA'].value_counts())
negative_samples = utils.negative_sampling(IEDB)
IEDB['label'] = 1
negative_samples['label'] = 0
IEDB = pd.concat([IEDB, negative_samples])
IEDB.reset_index(drop=True, inplace=True)

result, cdr3a_attn, cdr3b_attn = model.test_model(df_test=IEDB, device=device, targets='hla', hla_dict=hla_dict, hla_model_dir='HLA_model.pt')
IEDB['pred'] = result

plot_roc_per_hla(IEDB, pred_col='pred', label_col='label', hla_col='HLA', top_k=10)
HLA
HLA-A*02:01    835
HLA-B*07:02    195
HLA-A*24:02     96
HLA-B*37:01     95
HLA-A*01:01     94
HLA-B*15:02     42
HLA-B*08:01     39
Name: count, dtype: int64
INFO:trimap.model:Loading alpha_dict.pt
INFO:trimap.model:No new alpha sequences found
INFO:trimap.model:Loading beta_dict.pt
INFO:trimap.model:No new beta sequences found
INFO:trimap.model:Predicting...
100%|██████████| 16/16 [00:07<00:00,  2.17it/s]